
All about Scapretraction
Foto: Thomas Schönenborn| Wie wirft man härter? Spoiler: Es sind sehr, sehr viele Dinge, die dazu beitragen, und in diesem […]
Foto: Thomas Schönenborn| Wie wirft man härter? Spoiler: Es sind sehr, sehr viele Dinge, die dazu beitragen, und in diesem […]
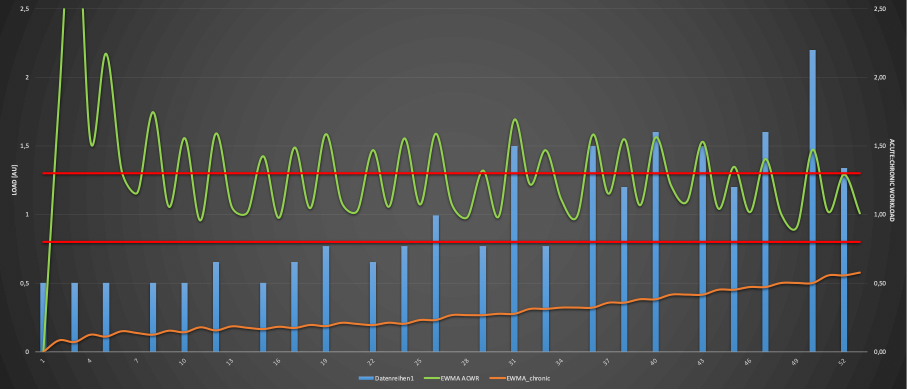
Die meisten Verletzungen des Arms passieren am Beginn der Saison (https://mikereinold.com/mlb-tommy-john-injuries/). Die Vermutung liegt sehr nahe, dass die Belastung in
Do you want to hide this popup?