Die meisten Verletzungen des Arms passieren am Beginn der Saison (https://mikereinold.com/mlb-tommy-john-injuries/). Die Vermutung liegt sehr nahe, dass die Belastung in dieser Zeit in vielen Fällen zu hoch für den Fitnesszustand der Spieler ist. Aus diesem Grund ist es sehr wichtig, nicht zu schnell zu viel zu werfen. Wenn man das macht, führt das sehr oft zu Armschmerzen.
Aber wie baut man den Arm am besten auf? Wie viel soll man werfen, wie oft und wie schnell soll man steigern? Um das zu beantworten, muss man ein wenig ausholen.
Um zu wissen, wie stark man einen Athleten belasten kann, ohne dabei Verletzungen herauszufordern, muss ich wissen, an wie viel Belastung er gewöhnt ist. Das nennt man die chronische Belastung. Sie besagt, wie viel Belastung der Sportler in den letzten vier Wochen durchschnittlich (vereinfacht) ausgesetzt war. Bei einem Läufer wären das zum Beispiel Kilometer. Diese Belastung, plus ein wenig mehr, sollte er also auch heute (die akute Belastung) leicht verkraften. Die Akute Belastung ist die Belastung der letzten 7 Tage. Die spannende Frage ist: wie viel ist „ein wenig mehr“?
Dividiert man die akute Belastung durch die chronische Belastung bekommt man ein Verhältnis. Die sogenannte acute to chronic workload ratio (ACWR).
Sportartübergreifend hat sich herausgestellt, dass man die Belastungssteigerung sehr gut über das Verhältnis der chronischen zur akuten Belastung (A/C-Ration) steuern kann. Dadurch lässt sich nachträglich relativ einfach beobachten, wie sich die Verletzungshäufigkeit mit der ACWR verändert.
Damit man dasselbe für Werfer machen kann, sollte man am besten die Belastung eines Wurfes wissen. Wenn man die weiß, kann man sie einfach mit der Anzahl der Würfe mulitplizieren und man kommt auf seine Tagesbeslastung. Das Problem ist allerdings, dass nicht jeder Wurf gleich viel Belastung verursacht.
Über Messungen sehr vieler Würfe, von sehr vielen Spielern, auf unterschiedlichen Distanzen (Modeling Elbow Valgus Torque From Throwing Distance With 627,925 Baseball Throws by Competition Level, 2019, Ben Hanson), kann man ganz grob Belastungszonen zu Distanzen zuweisen. Wenn man die Anzahl der Würfe pro Distanz/Belastungsbereich steuert, kann man auch die Gesamtbelastung es Wurftages steuern.
Genau das habe ich gemacht. Um das Verhältnis der akuten Belastung zur chronischen Belastung (die A/C-Ratio) über die 6-8 Wochen On-Ramp-Phase um oder unter 1,5 zu halten (siehe nächste Seite), habe ich für jeden Tag die Belastung angepasst und die ACWR berechnet. So bin ich auf die Wurfanzahl und Distanzen für jeden Tag gekommen.
Nach der Onramp Phase ist der Arm fit genug, um ausreichend Spielraum zu haben auf dem Mound bei höheren Intensitäten zu arbeiten, und die chronische Belastung weiter aufzubauen.
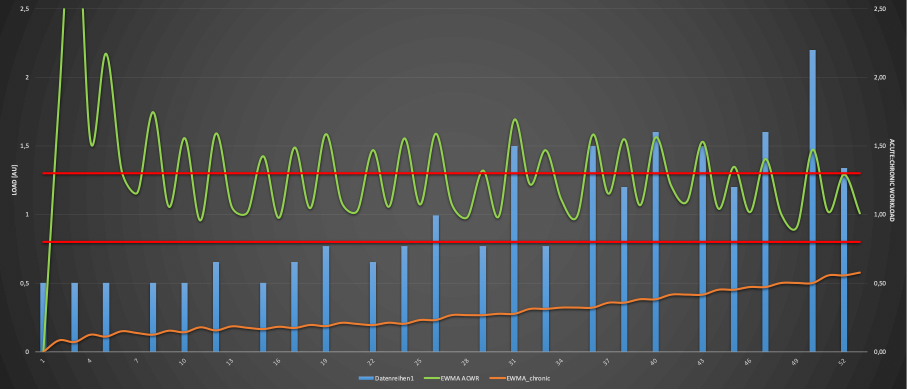
In der Grafik sieht man ein paar wichtige Werte. Die grüne Linie ist ACWR. Sie sollte möglichst zwischen den zwei Roten Linien liegen.
In den ersten Tagen ist die ACWR deutlich höher als angestrebt – das hat mathematische Gründe. Da die chronische Belastung zu Beginn null ist (bzw. auch nach ein paar Anpassungen und Gewichtungen sehr niedrig), musst das Verhältnis entsprechend hoch sein. In der Realtität ist der Arm/Körper bei einem gesunden Sportler aber nie komplett Belastungsunfähig. Der Startpunkt ist aus diesem Grund auch der am „willkürlichsten“ in dieser Berechnung. Auch danach springt der ACWR immer wieder über die Rote Linie. Das erachte ich aus Folgenden Gründen als vertretbar:
- Lässt man das nicht zu, muss über wesentlich mehr Wochen gesteigert werden. Ein 12 wöchiges Onramp Programm, bevor Pitcher auf den Mound gehen, ist nicht realistisch und eher nach Verletzungen angebracht. Damit verliert man unter Umständen mehr Pitcher an Langeweile als an Verletzungen 😉
- Je kürzer die Wurfpause war, desto fitter ist der Arm. Selbst nach einem (oder mehreren) Monat(en) Wurfpause sinkt die Armbeslastungsfähigkeit nicht komplett auf das Niveau von Untrainierten. Da die chronische Belastung aber über 4 Wochen gemessen wird, wäre das in dem Modell aber der die Annahme und funktioniert deswegen in den ersten Tagen nie optimal.
- Je niedriger die absolute Tagesbelastung bei diesen Überschreitungen ist, desto weniger drastisch sind die Auswirkungen der Überschreitung. Am Anfang können eine Handvoll Würfe auf 120 eine rechnerische Überbelastung bedeuten. Ich denke, dass wir uns darauf einigen können, dass „Noch ein Wurf“ kaum die Ursasche für eine Überlastungsveretzung sein wird. In diesem Modell können ein paar extra Würfe zu beginn des Programms genau diesen Eindruck vermitteln. Das halte ich aber für übertrieben.
- Das Überschreiten der ACWR bedeutet nicht eine sofortige Verletzung – lediglich, eine Erhöhung des Risikos. Wie schon angedeutet, muss die Höhe und Dauer der Überschreitung ebenfalls in Betracht gezogen werden.
- Ziel ist es, das Verletzungsrisiko zu einem annehmbaren Preis zu minimieren, nicht zu jedem Preis zu eliminieren. Eine übermäßig vorsichtige Herangehensweise könnte zwar noch ein wenig „sicherer“ sein, kostet aber mehr Leistungszuwächse und ist vor allem extrem monoton. Welcher Pitcher möchte denn mit kaum Fortschritten für viele viele Wochen langsam werfen?
Die blauen Balken stellen die Tagesbelastung dar. Diese werden später bei Spieleinsätzen noch wesentlich höher sein als in dieser Onramp-Phase. Die orange Linie stellt die chronische Belastung dar – auch sie wird nach der Onramp-Phase noch weiter steigen.
Je höher die chronische Belastung ist, desto höher ist der Fitnesszustand. Ein höherer Fitnesszustand ermöglicht mehr Pitches pro Tag und Woche, ohne eine Überlastung zu riskieren. Das ermöglicht wiederum mehr, und vor allem auch qualitative besseres, Training am Mound und mehr bzw. längere Spieleinsätze.
Das Modell hat einige Limitierungen, die man zum Beispiel durch kontinuierliche individuelle Messungen von jedem Wurf (zum Beispiel mit einem PULSE Sensor) oder zumindest durch Erstellen von weiteren und genaueren Annäherungen verringern könnte. Als Grundalge für eine Onrampphase für gesunde Pitcher scheint es aber sinnvoller erster Schritt zu sein.
Eine detaillierte Anleitung zur Umsetzung findest du hier und hier.